
Overview
Team
1 Designer
3 Engineers
2 Learning Scientist
1 Product Manager
1 QA Tester
My role
Research
Interaction Design
Visual Design
Duration
Nov 2016 - Mar 2017
Background
Kidaptive's Adaptive Learning Platform (ALP) brings adaptive learning into Educational products. We are working with educational companies (partners) to capture their student data to provide a personalized learning experience. We received requests from our partners about the need for data analytics tools where they could review education-centric metrics to make better product decisions.
Problem
Our partners generate tons of data flowing into their systems. However, currently, they can't build infrastructure to leverage data to make better product decisions. Our partners realized that they do not have access to data to fully understand learner behaviors. There are many analytics tools out there to show many fundamental matrices about user and product behavior. However, educational companies, need data to measure learner activity data, including content efficacy, overall learner engagement, and performance by their applications, etc.
Our users
In our partners' companies, there are typically many different roles involving educational product development. We started the project by meeting with our partners to figure out what kind of metrics they were already tracking and what new ones they wished to track. We nailed down a list of metrics into three main categories.
User activity - How is the product doing? What is the user engagement?
Content quality - How are the contents being used? Are they appropriate for our learners?
Learner performance - How is the learners' performance? Does it improve after using the product?
Design solutions
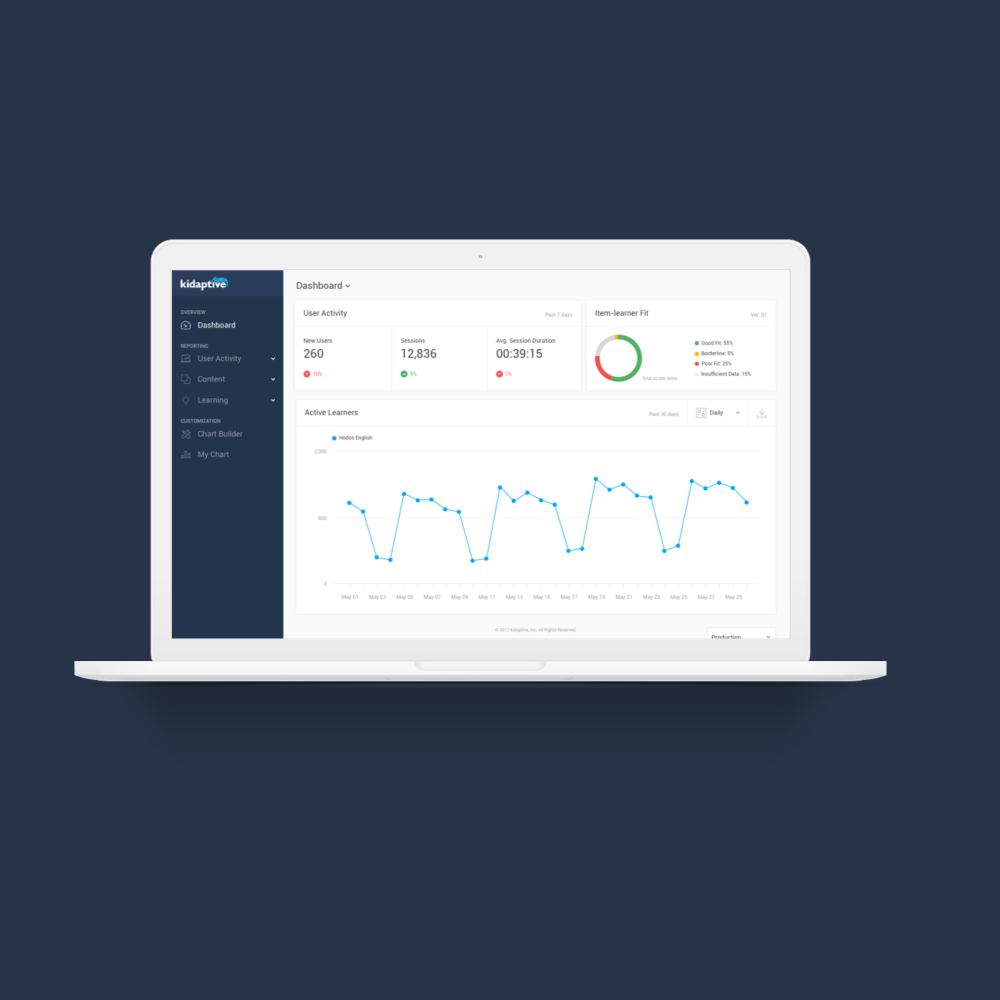
We created an analytics dashboard to provide learning-centric metrics in terms of content quality, user activity, and performance to help them make data-driven decisions to improve their learning products. Here are some of our key features.
The right visualizations to understand how learners explore learning products
13 predefined metrics will help you answer any questions for your learning related needs. I worked closely with our learning science team to provide the most important metrics to measure content quality and learning efficacy.
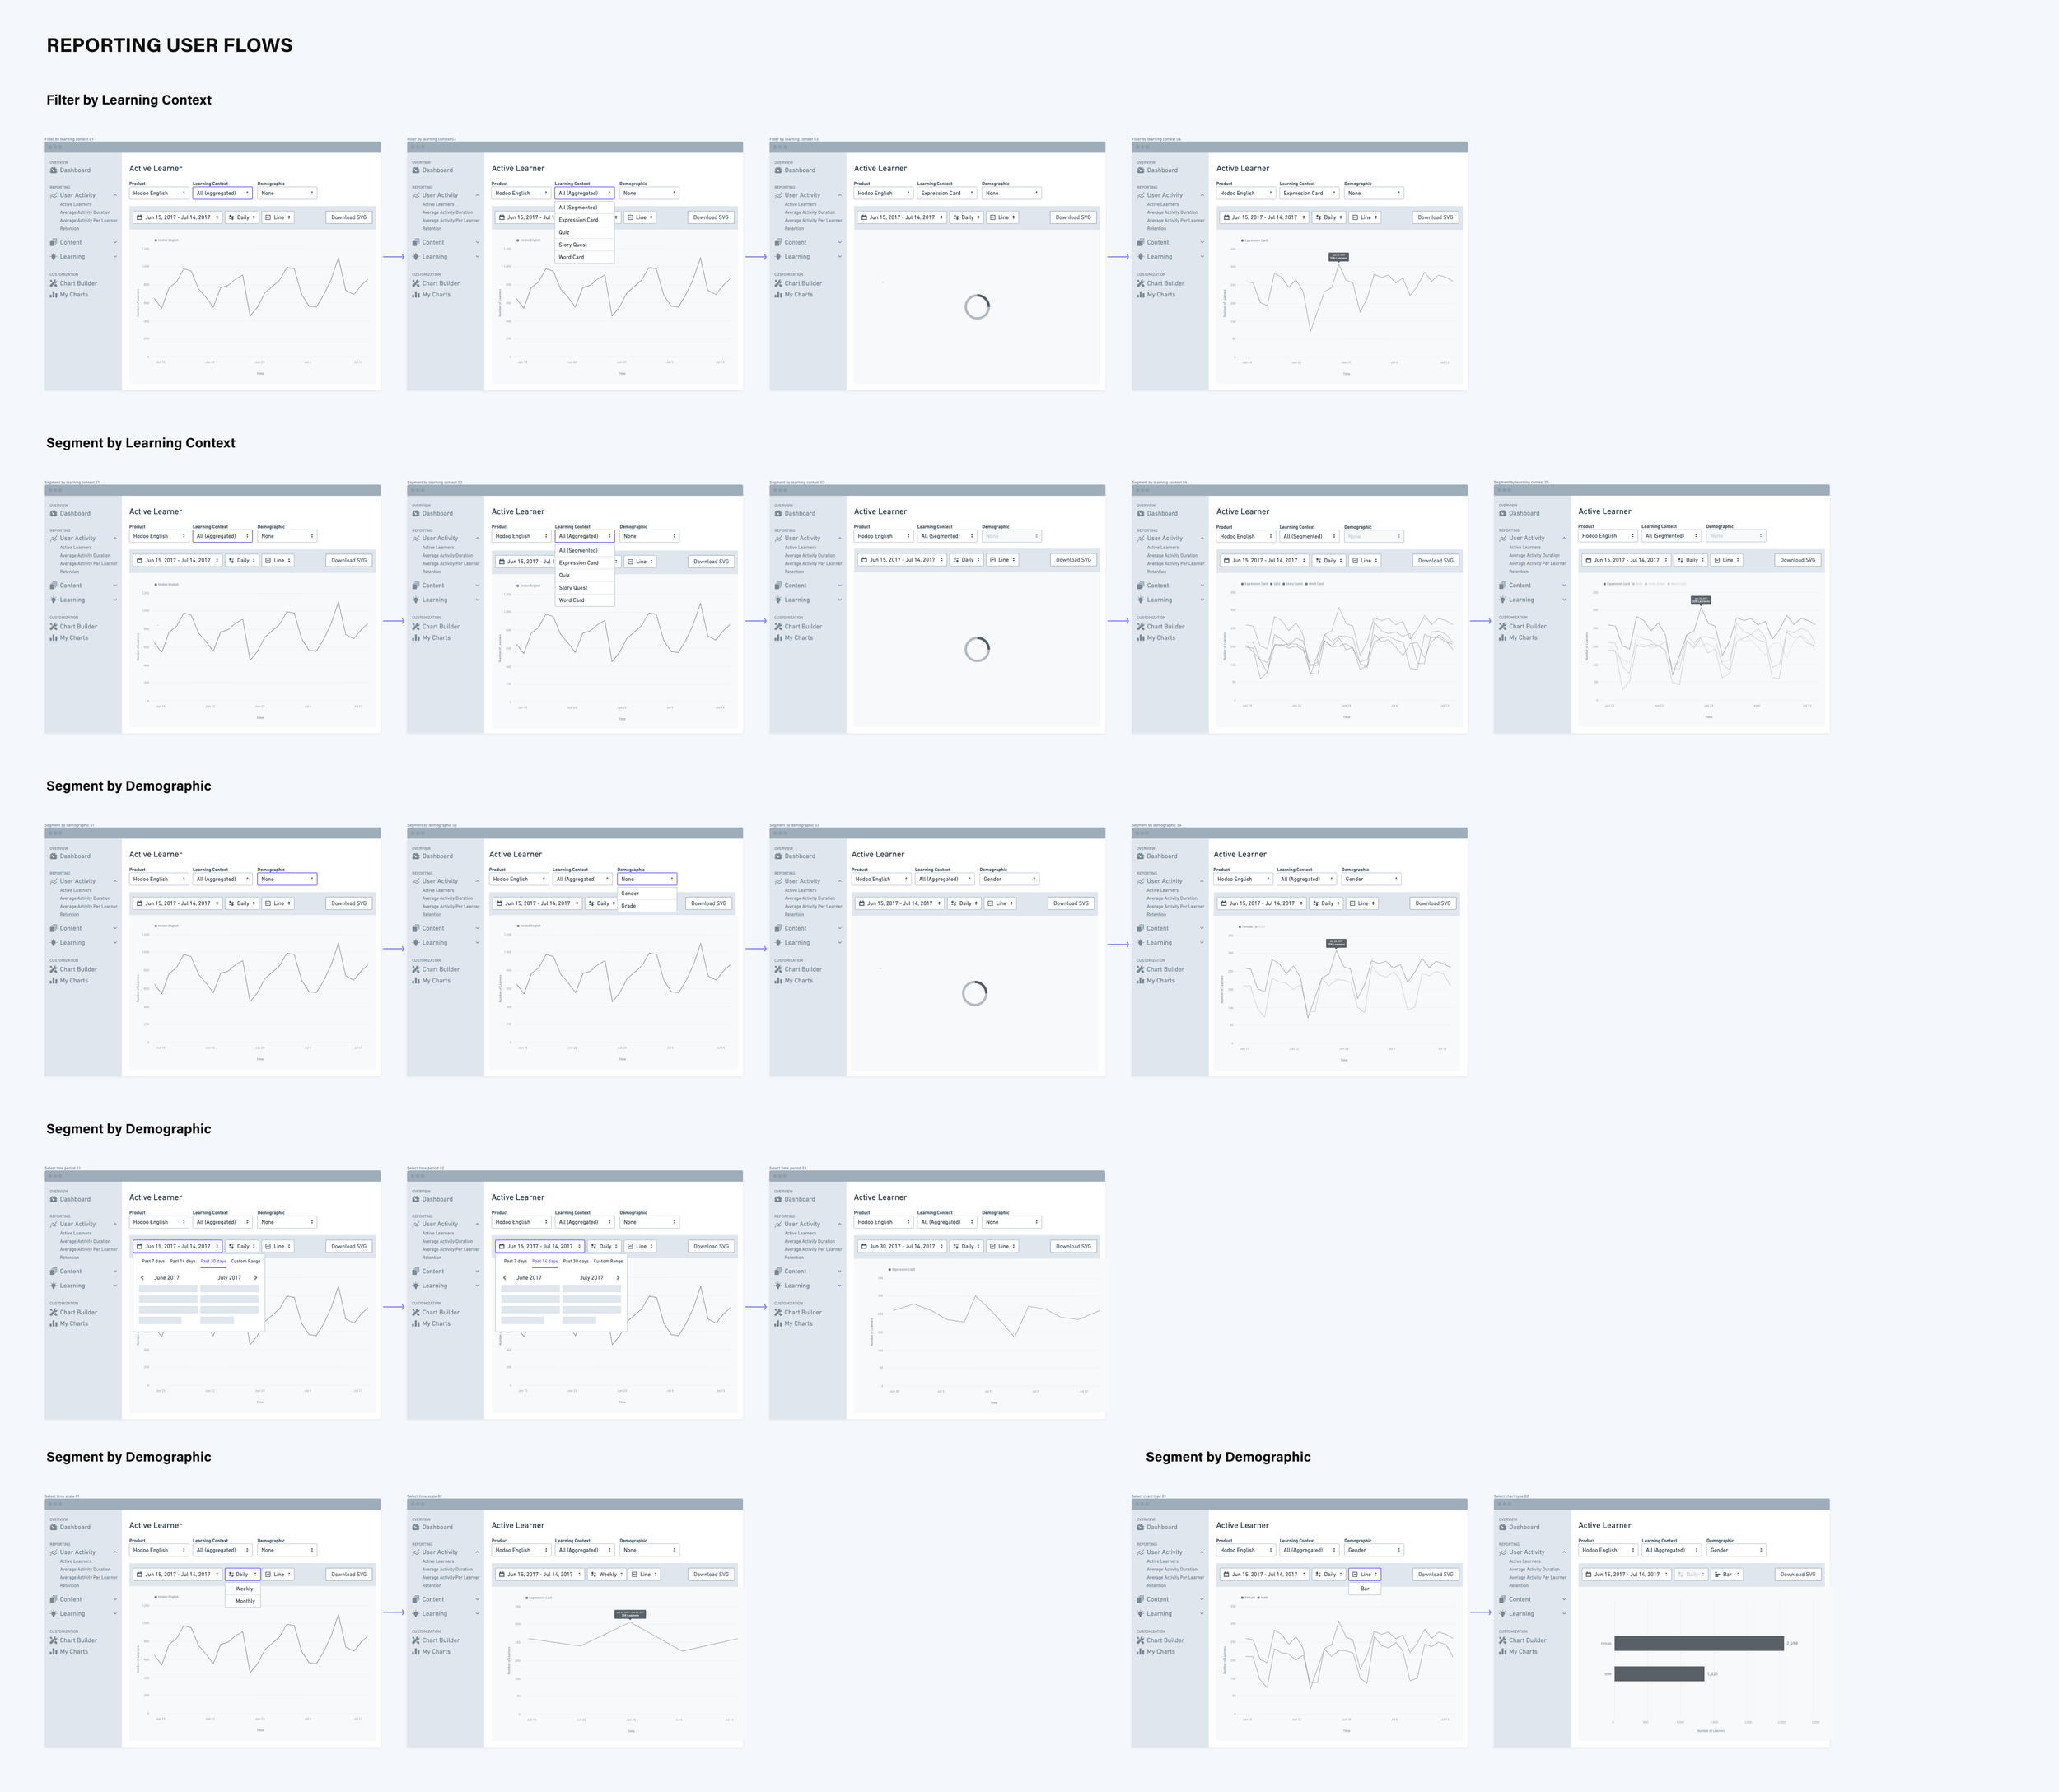
Apply filters and segments to understand various learner groups from different angles
Filter and segment functions make it easy for users to drill down into the details. It helps understand different learner groups in terms of behavior, retention, and content usage, to allow users to make optimal product decisions.
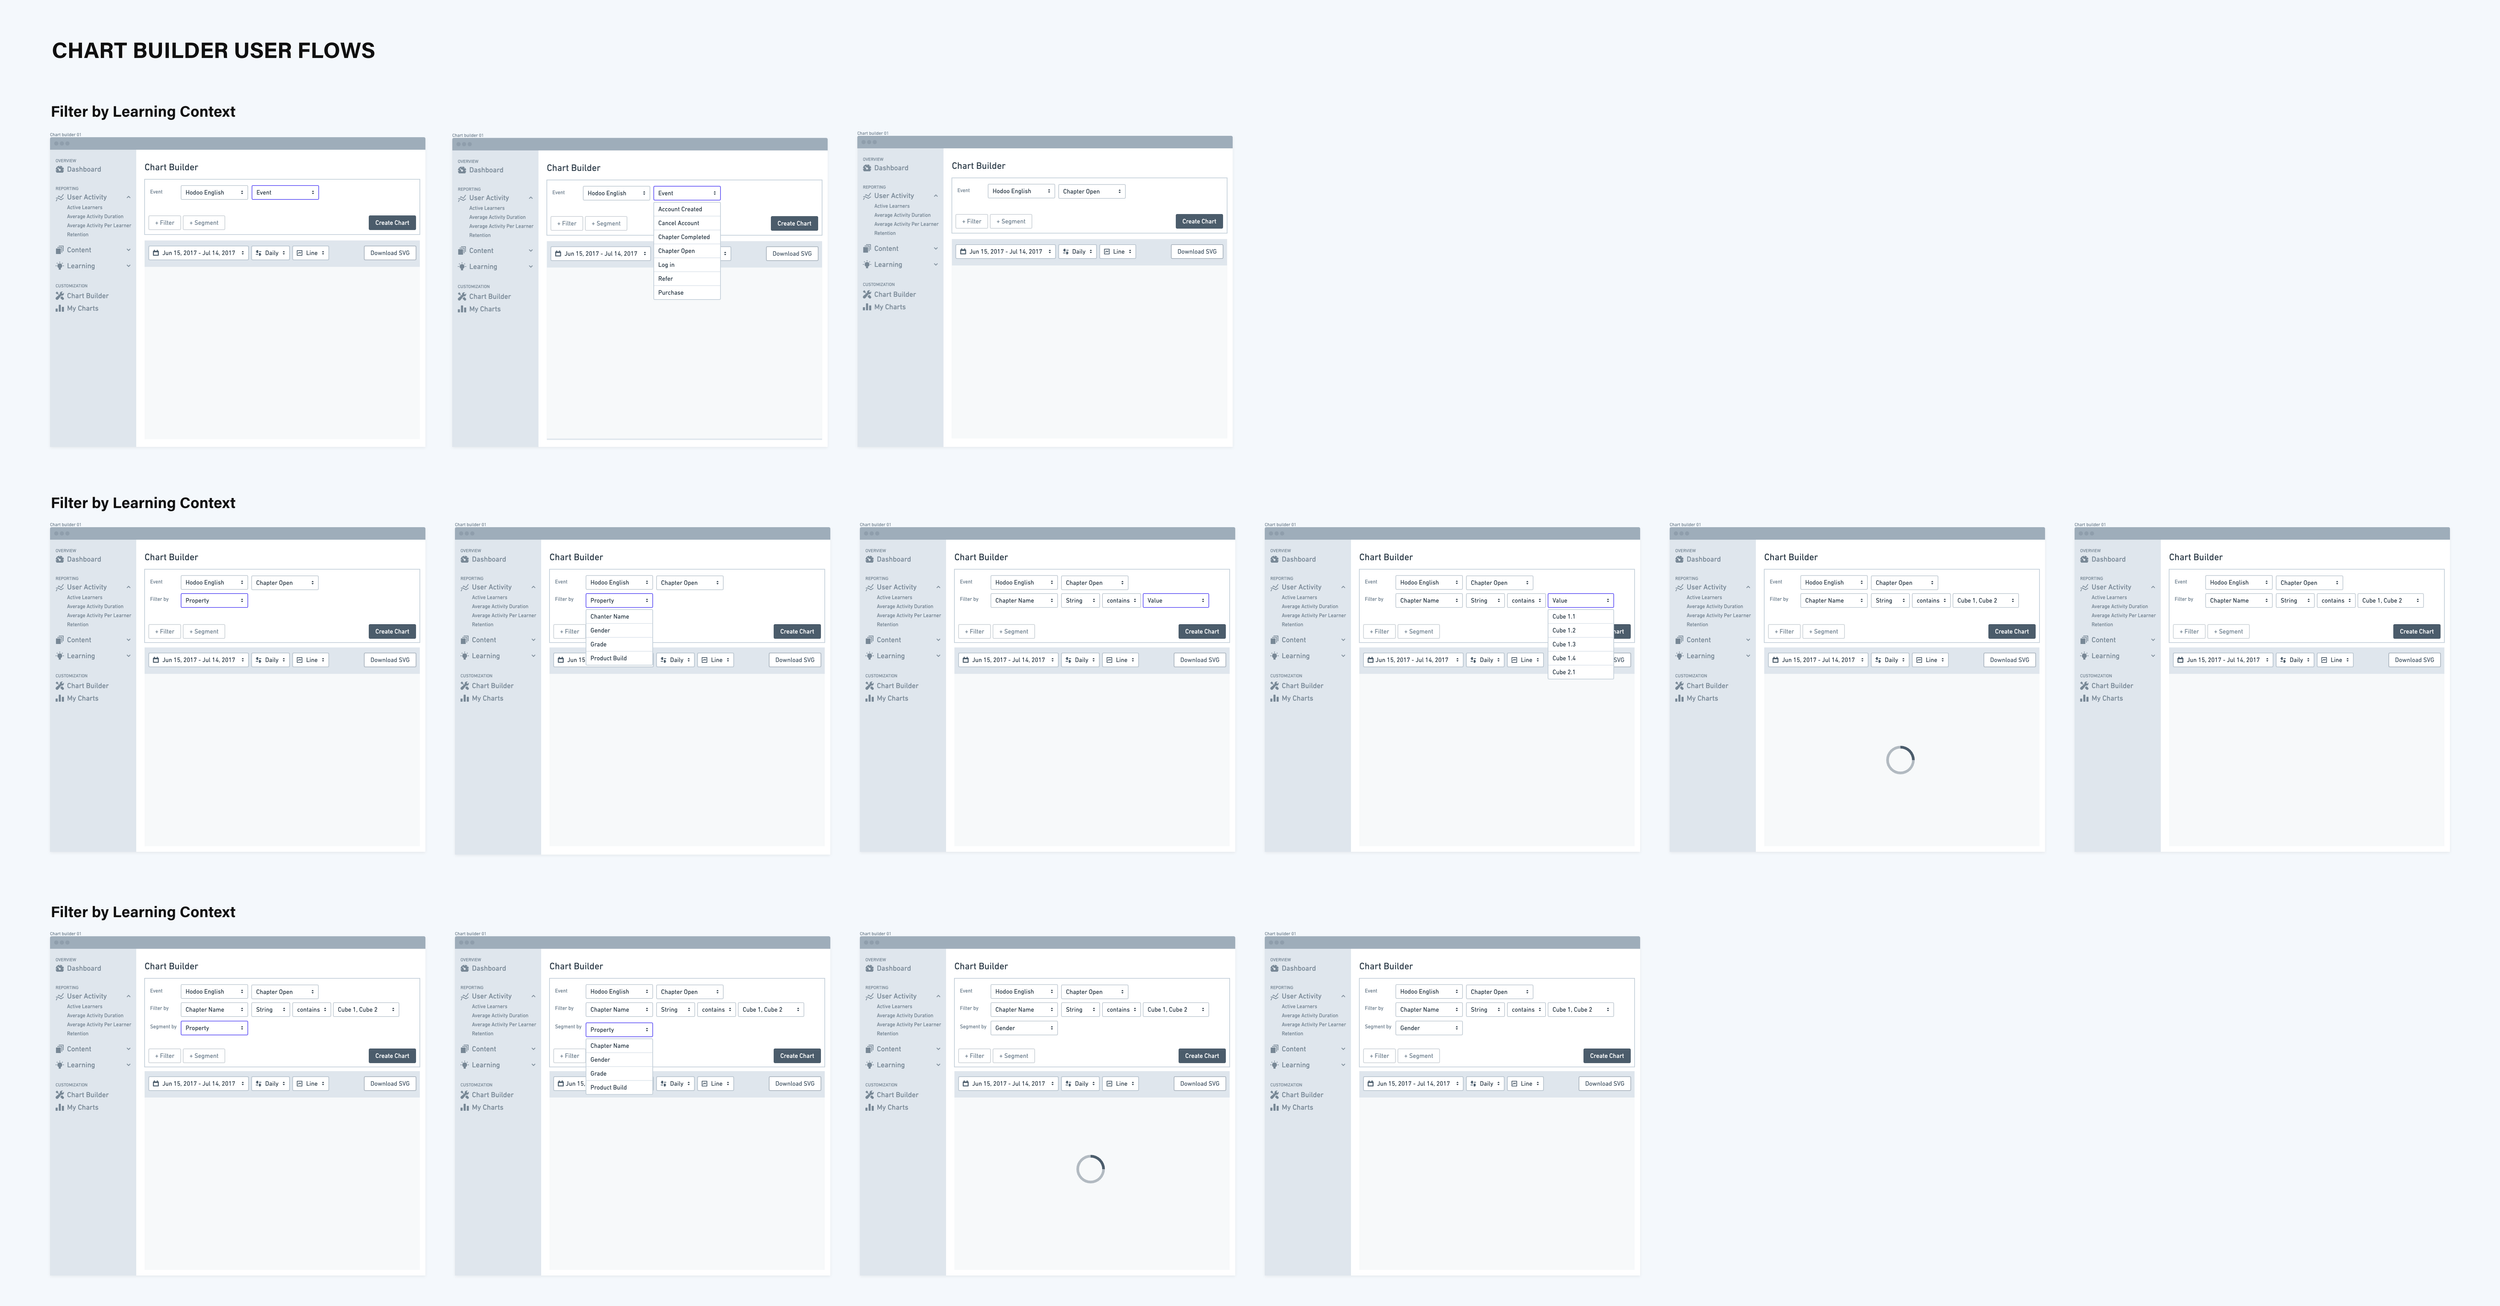
Build custom charts to dig into the details
Our chart builder offers more flexible ways to refine the data and visualize it. This feature allows users to track metrics that matter to them and will enable them to drill down to the finest details. Users can use the advanced filter and segment functions as well as manipulate multiple settings such as default date range, time scale, and the type of chart shown to create their custom charts.
Impact
This V1 analytics dashboard helped us understand the product and market fit as well as users' needs. With the feedback we received and solid design foundations, we could release the next versions quickly to acquire more partners, with more data flowing into our platform.
Research
User interview
Our team interviewed one of our partners and other educational product companies. Our goal was to understand more about what kind of data analytics they are seeking and why as well as the current processes and paint points they encounter in making data-driven product decisions. We identified these three main key findings.
Lack of analysis of individual learning content and skills
For educational products, it's essential to measure how the learners are mastering specific skills and all the individual learning items that support mastering those skills. For proper learning outcomes, it's vital to present appropriate content that helps learners understand and practice. Most of the companies said they couldn't find any service or tools to measure such things, so some of them had to build and maintain their data tools to pull the data and analyze it, which takes a lot of time and resources.
Different roles need different data
Creating learning products requires different types of professionals working together. Among the team members, there might be some common interest in the kind of data they would like to track. However, some roles such as a learning designer might need a more in-depth analysis of content-related data to fine-tune their design.
Difference in proficiency in viewing and understanding data.
Companies are aware of the importance of access to the data. However, in the organization, there might be some people who are savvier in pulling data and understanding it, and for some people, this might be a difficult task. These users would often ask more proficient ones to pull data for them, making the process less efficient.
Defining objectives and scope
The research phase made it easier to define the scope of the project. Here are the main design goals of Kidaptive’s analytics tool V1 :
Create a concise and clear analytics platform to help users make the right product decisions quickly.
Create a user experience that supports various users’ needs based on their roles and interests.
Provide the right data visualization to understand learning-related data quickly and easily.
Accommodate various users’ proficiency by providing ways to explore data quickly and easily, and drill down deeper if needed.
Create groundwork for a design system for consistency and scalability in the future.
These objectives guided me during the whole design process and helped me to nail down many design decisions.
Design Process
Ideation & Information Architecture


Wireframes
High-fidelity design

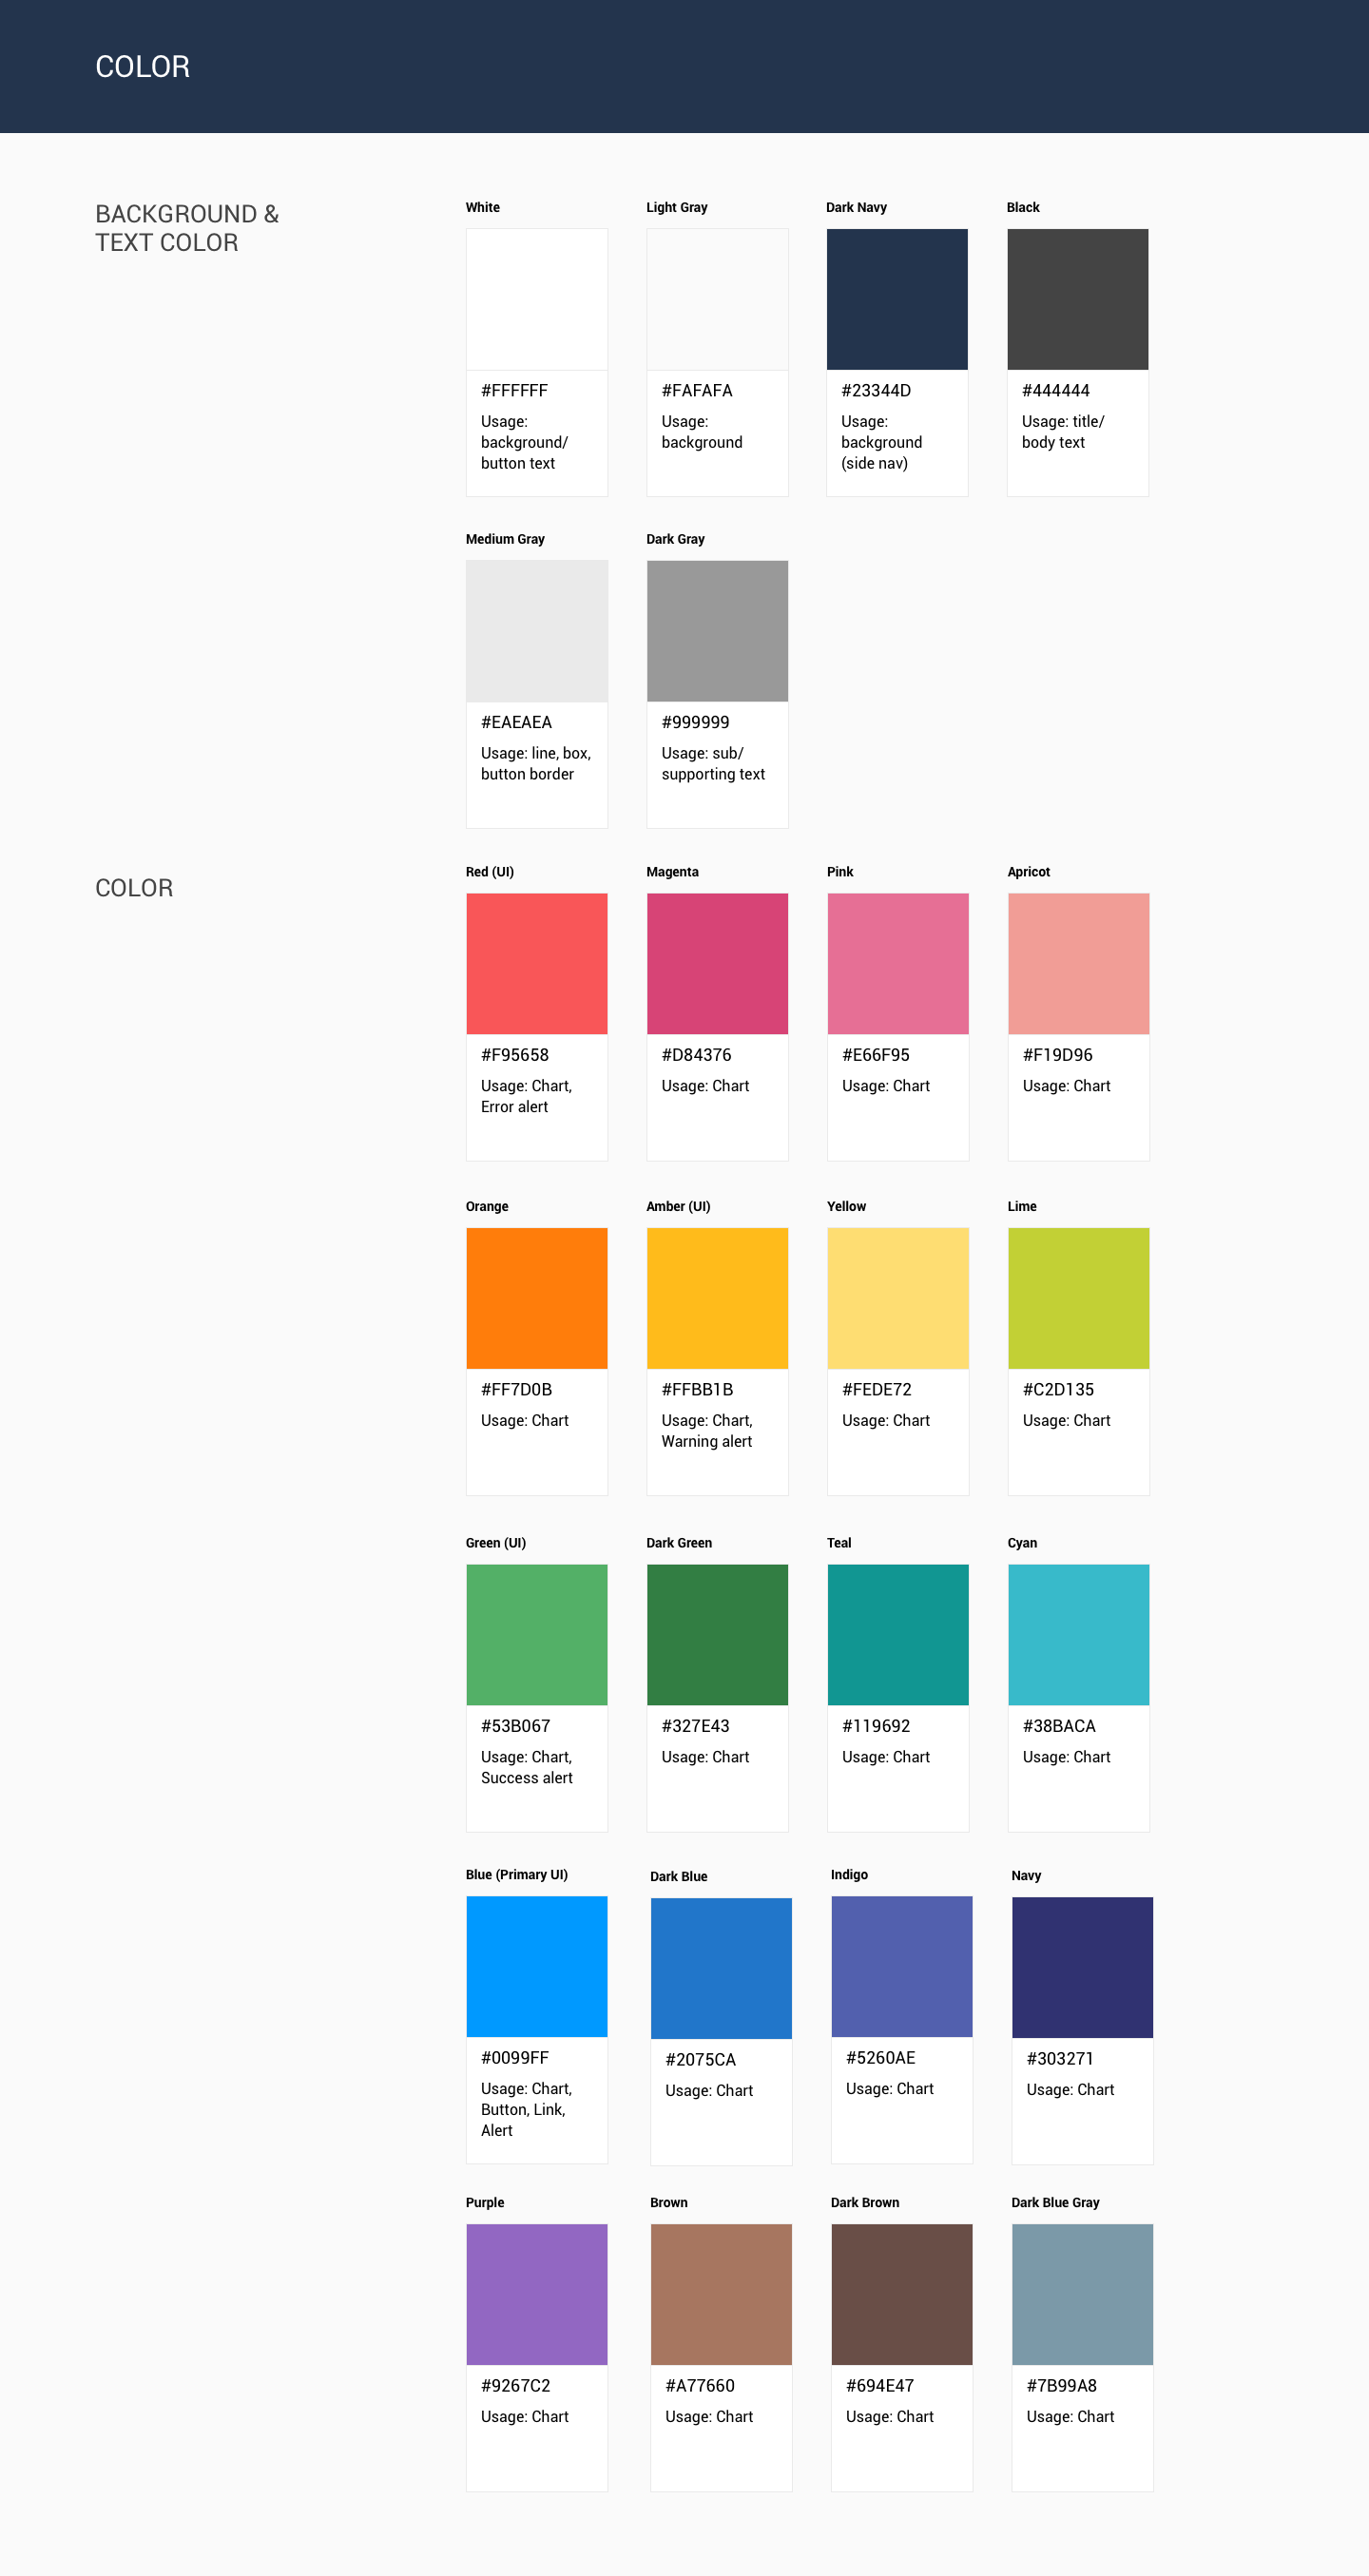
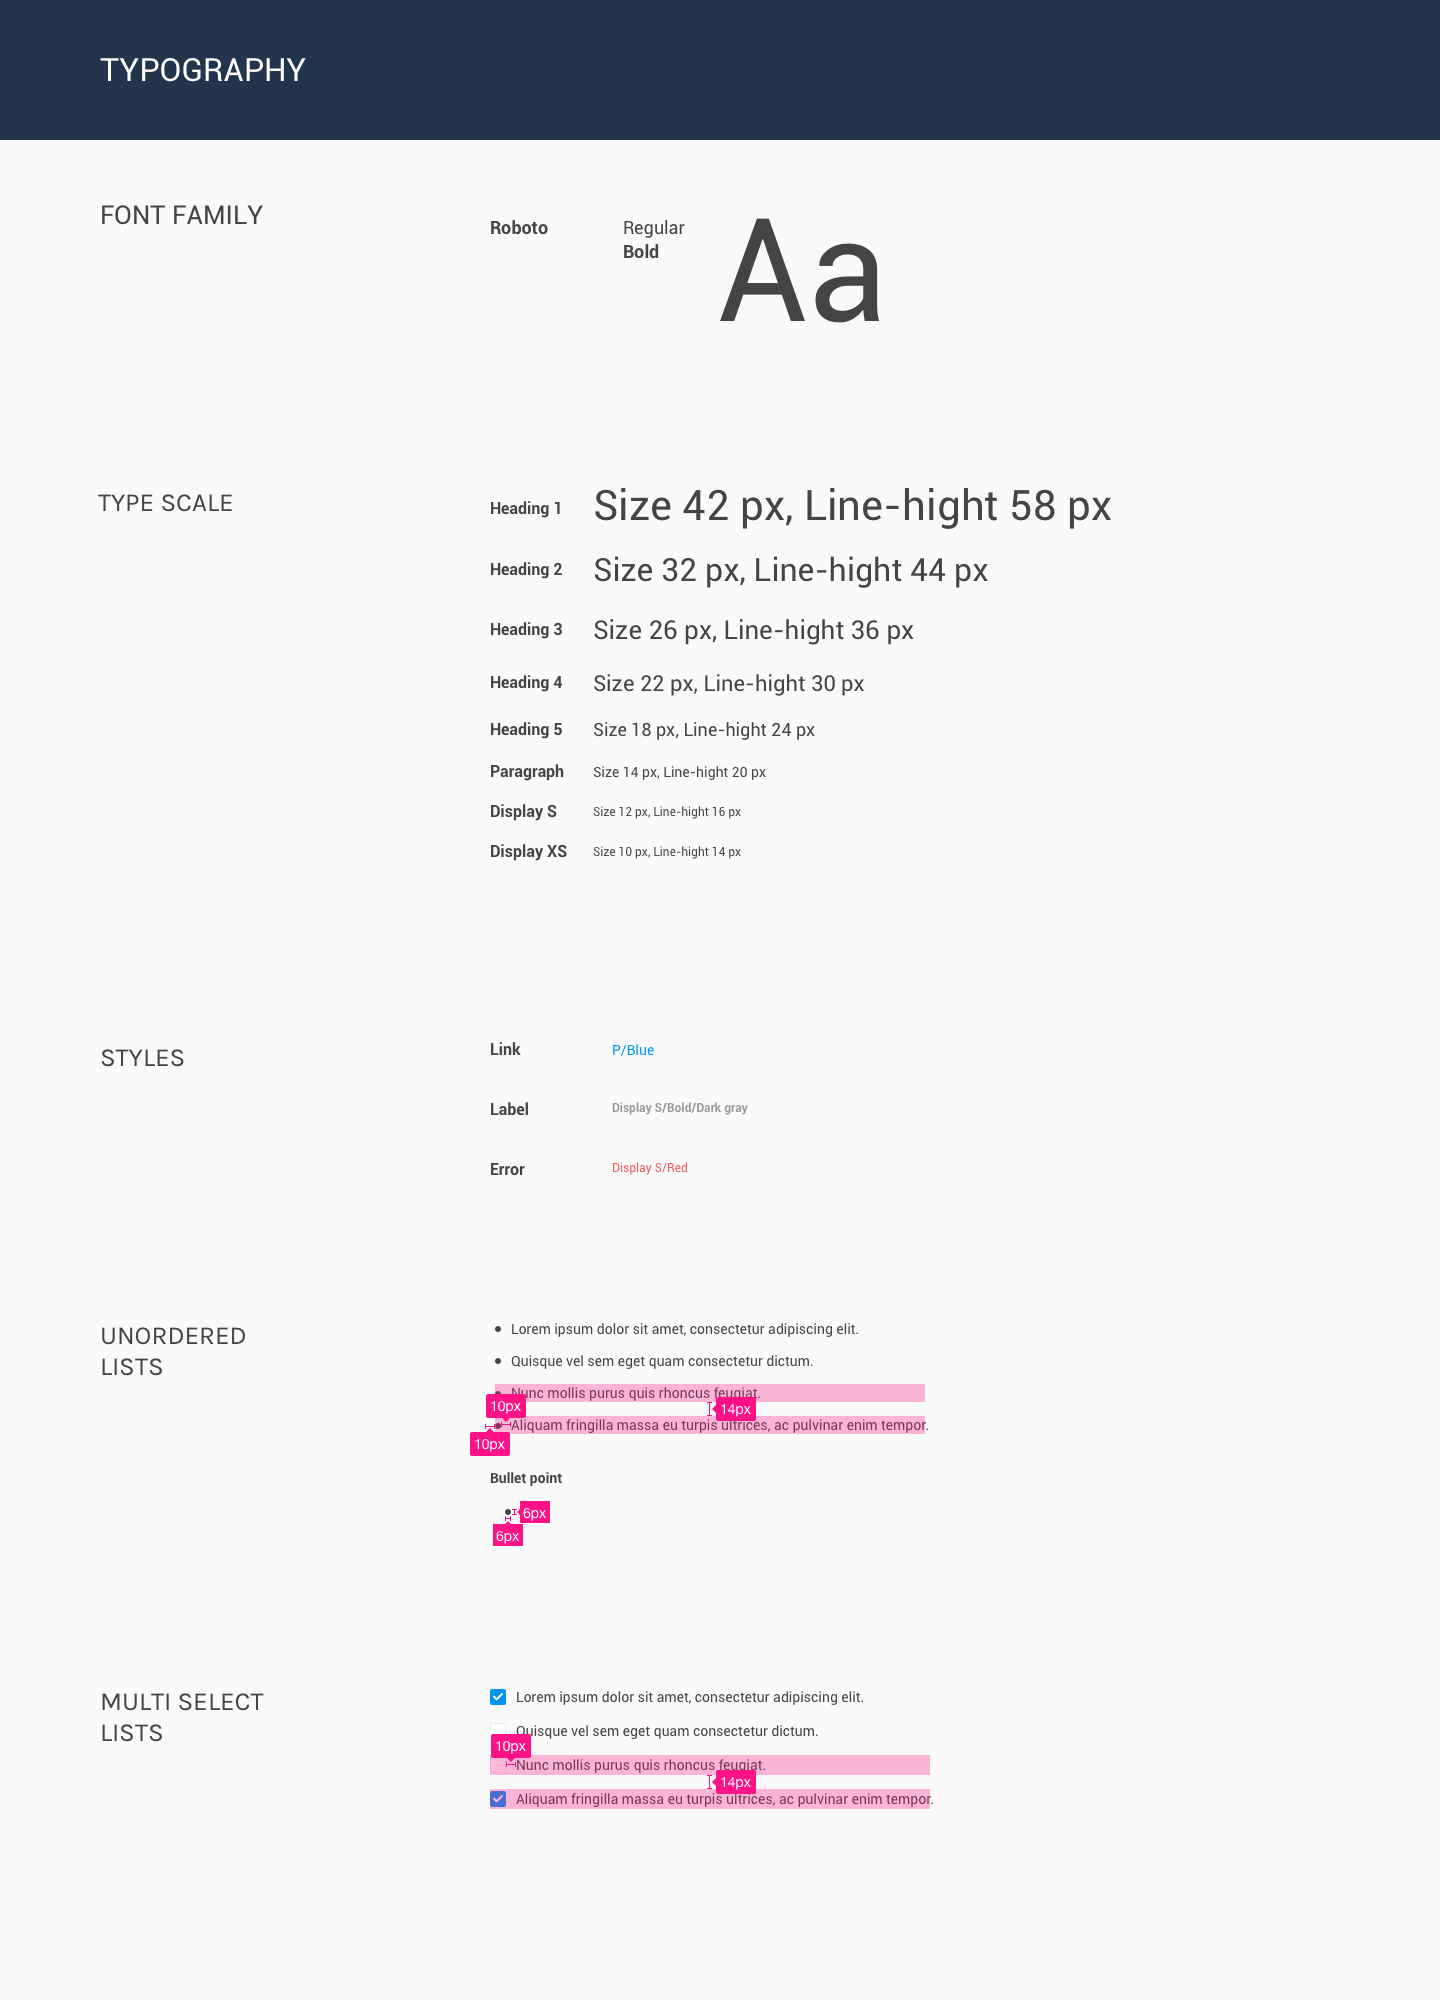
Style Guide
Thanks for reading my case study!