

Overview
My role
Lead the end-to-end design that includes user research, interaction and visual design, prototyping, and usability testing.
Team
2 Designers
2 Engineers
1 Learning Scientist
1 Product Manager
Duration
6 months (July 2019 to Feb 2020)
Platform
Web
Impact
We received funding from our partner company to set up a joint venture together, and our partner was delighted with the product.
Background
Kidaptive's Adaptive Learning Platform (ALP) brings a personalized learning experience to educational companies by collecting and analyzing their learners' data. Our platform proved its value of increasing engagement and better learning outcomes. This project started when one of the leading SAT prep companies in China contacted us (I will refer to them as our partner from now). Our partner company's goal is to become a market leader by building a next-gen online SAT prep system to attract more students and consolidate small cram schools by having them adopt their new system.
Business problem
Our partner's current business model is a traditional classroom-based cram school. Their classes and contents are not digitized, and they don't have a centralized system to store students' progress and personal data. Because of that, they were encountering problems when scaling their business:

Using paper-based materials makes it hard for them to collect students' data to improve curriculum and learning outcomes.
SAT prep market is getting more competitive in China; without key differentiators to prove efficacy, it’s getting harder for internal staff such as college consultants to convince students to enroll.
Disorganized student information causes internal staff to waste time searching for students' data when needed, and increasing the possibility of losing data.
Design problem
We set our design problem, "How can we enable personalized and data-driven learning to improve the SAT prep experience in traditional cram schools?"

Our primary users are high school students in China and college consultants who are working at our partner's cram school, and are in charge of counseling students. The students' goal is to reach their SAT target scores more efficiently because they are busy with other college prep work and high school schedules. The consultant's goal is to convince students to enroll in their program and provide more concrete feedback on the students' current level and plan.
Design solutions
Our team created a complete SAT prep solution with accurate diagnostic tests followed by a personalized analysis report and test admin tool where internal staff such as consultants can easily access student data.
Digital SAT diagnostic test
The SAT journey starts by taking a diagnostic test to see the students' current SAT skill level. The official SAT is paper-based, but we are transforming it into a digital test. While we were designing the digital test experience, our design team took significant considerations to support typical paper test taker's behaviors, so the test scores are accurate and reliable. This test helps the system get a sense of the student's starting point to provide a personalized analysis report with class recommendations.
Personalized test analysis report
Once the test is complete, the system generates a report. This report helps students to understand the gap between their goals and current skill level. It also provides a detailed breakdown of their score and skill weaknesses. This report will help students to decide what to focus on in their busy schedules. For consultants, this in-depth analysis will help them facilitate conversations with students to convince them to enroll.
Centralize the students’ data with an admin report portal
The students' information and reports are stored in this test admin report portal. Currently, in our partner's cram school, students' information and test scores are saved in multiple spreadsheets separately, so it's hard to track students' progress. This disorganized way of storing data makes consultants spend extra time looking for students' data when they are following up with them. Also, it increases the possibility of losing data. With this admin report portal, consultants can access student test scores, test analysis reports, and personal information all in one place.
Research
User interview
We conducted user interviews with four students who have prepared for the SAT test in China to understand the context of SAT preparation and test-taking experience in China. In addition, we had interviews with three consultants from the partner’s cram school to understand the infrastructure of the current SAT program to find out design constraints/opportunities.
Categorizing the interview findings
Student interview key findings
Students have limited time to do SAT prep due to other college prep-related work and school schedules. Knowing their strong and weak points is vital for them to use their time wisely.
Students have some target scores in mind and once their SAT score gets near that target score they stop SAT prep.
Taking practice tests is not enough. Understanding the reasons behind wrong answers is the key to improvement.
Consultant interview key findings
Consultants interact with students frequently before they enroll in classes. Once they sign up, they follow up with the students occasionally to provide guidance for overall college prep.
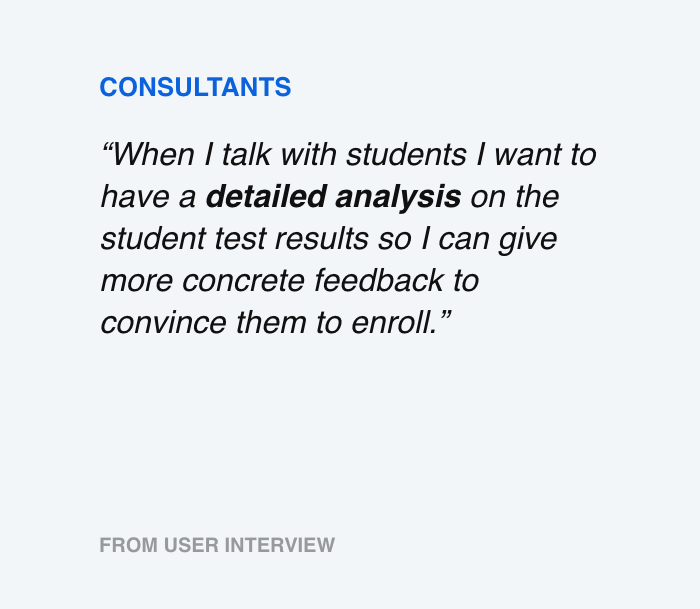
Consultants can only provide general feedback about students' test scores, and that general information sometimes makes it hard for them to convince new students to enroll and stay on the program.
Currently, students' information and progress is stored in multiple spreadsheets, so it takes extra time for consultants to look for students' data.
Interview synthesis
Customer journey map
Based on the data from interviews, we've mapped out the students' and consultants' journeys. We broke down the whole journey into various touchpoints and all the related tasks with pain points. This map helped us to expose the pain points and opportunities of our personas. Besides, it enabled us to facilitate discussions with the team and help them have more context on our users and decide the priorities and scope of the project.
Project scoping
Based on the research, our team decided to focus on creating a product eco-system to conduct diagnostic tests with personalized analysis reports and easy access to students’ data. Our team and partner decided to narrow down the project scope and focus only on the diagnostic tests this time because we want to understand the product-market fit and efficacy by evaluating engagement and student interactions with the product before building a large system.
Diagnostic test design process
Setting up the fundamentals
Since the real SAT is paper-based, our design team had to find ways to transform the experience to be computer-based while keeping the core experience. It is essential to take a diagnostic test like the official test to get accurate and reliable results. We started to deconstruct the official SAT test design as well as other existing SAT test-prep services. We mapped the user flow and it helped us to gain a good understanding of the entire process.
User flow
Once we set up the test experience flows, we moved to layout design. We researched the official SAT design and other existing SAT test-prep services to understand a layout that could be familiar to our users. We went through a few rounds of iteration using sketches and wireframes.
Interaction design and prototyping
With the skeleton and the wireframes validated with our internal team and partner side, our design team started to iterate on the design and made possible solutions to test out the design. Based on the user interview and the analysis of the real SAT experience, we came up with a list of typical SAT taker’s behaviors and designed interactions based on that.
Students need to mark difficult questions to revisit
On the paper test, students would mark on their test paper some of the difficult questions to revisit later. To support that behavior, we provide a way to mark the question and provide a shortcut on the bottom left so the student can jump to the marked question to review it again.
Students need to review answers before submitting and be able to navigate to any questions easily
On the paper test, students use answer sheets to check if they have skipped any questions before they submit the answers. With the paper and answer sheets, navigating to the questions is quite easy. To support that behavior, we create a review page where the user can check their answer states (answered, unanswered, marked) and jump to the question they want to check.
Students need to check the remaining time
It takes 3 hours to finish a full SAT test. There are four sections, and each section has a different time duration. All the students we talked with said managing time is a critical part of the test. In the internal meeting, we discussed whether the timer should be hidden or shown by default. Some team members thought that showing the remaining time might distract students. I thought it might be annoying having to do an action to see the time. We couldn't agree with each other, so we decided to do a usability test on this.
Usability testing and iterations
Our design team conducted usability tests to observe how people interact with our current test UI to see if the current design supported people's desired behavior. We measured our design in terms of functionality, efficiency, and satisfaction. We recruited four people who have experience taking the SAT before. We observe how the testers interact with our prototype while completing given tasks. Thanks to this we could identify some design issues.
Based on the usability test takeaways, we iterated on the design.
Test page iterations
Review page iterations
Second usability test
Our design team used the same method to conduct one more user test with three new testers. The results were positive, so we settled on this version of the design.
Report design process
Recap of the user interview
After synthesizing the user interview, these are some of the user quotes that our design team thinks are essential to consider while designing the report.

Ideations and validations
First, our design team researched the reports from the official SAT. We learned the official terms, score breakdowns, and the information hierarchy that students are already familiar with. We had discussions with our team’s learning scientist to figure out what kind of analysis we can provide. We found out we can provide even more in-depth information about students' skills, so we started exploring early concepts.

Idea sketches
Early Concepts
In these explorations we were focusing on:
Presenting the gap between the student's current score and their goal alongside with the score distribution to help the students understand and estimate their prep journey.
Providing a detailed analysis of the student's test results to spot their problem areas and decide the next steps.
With the early concepts, we decided to do a concept test with the three students we talked with before the user interview. We received feedback from the concept test that guided us to move on to the next iterations.

Categorizing the concept test findings
Design iterations
Current and target scores
The main feedback we got for this visualization is that students would feel worried if there is a big gap between the actual score VS their goal score. So our design team looked for ways to reduce student anxiety when the difference between the current and the target score is too high. The first approach is to break down the gaps between both scores into small milestones. The next approach shows other students' score histories, especially those who had a similar score at the beginning. Our team and the consultants liked this idea, but we found out that in the first version of this product (V1) we wouldn’t have access to the historical data. In the end, we nailed a design to show the gap based on the cram school's class level. With this approach, students can understand how many classes they need to take in order to reach their target scores. Having a good plan estimation will reduce students' anxiety.
Total and target scores iterations
Section scores and analysis
The main feedback we got for these visualizations from the concept test is that students like the overall detailed analysis, but they feel overwhelmed too. Since this report is generated after the diagnostic test, they might not be familiar with some skill terms we are using in the report. Also, some of the information might be more beneficial toward the middle or end of prep. With that feedback in mind, our design team iterated the design to provide the right level of relevant information.
Score breakdown iterations
Detail analysis iterations
Reflections
Lessons learned
Importance of prioritization: There were big visions and great features that could have possibly helped our users. However, it’s always important to keep in mind our business goals and limited development time and cost. I helped our team and stakeholders to empathize with our users and determine how to build the essential features to tackle the most critical problems.
Over-communication is key to success: This project is a collaboration between many different stakeholders from various backgrounds and cultures. Our design team over-communicated and always provided the reasons behind each process to help the team and stakeholders understand our design decisions and direction. In the end we were able to build a product that our company and partner were satisfied with thanks to this extra effort.
Thanks for reading this case study!